charter-app
Charter App Documentation
Charter
- Image control
- Import Settings
- Load Image
- Load Chart
- Sampling Settings
- Multi Sampling
- Estimate Black Level
- Estimate White Ballance
- Estimate CCM
- DeltaE
- Copy/Paste WB&CCM
Charter GUI
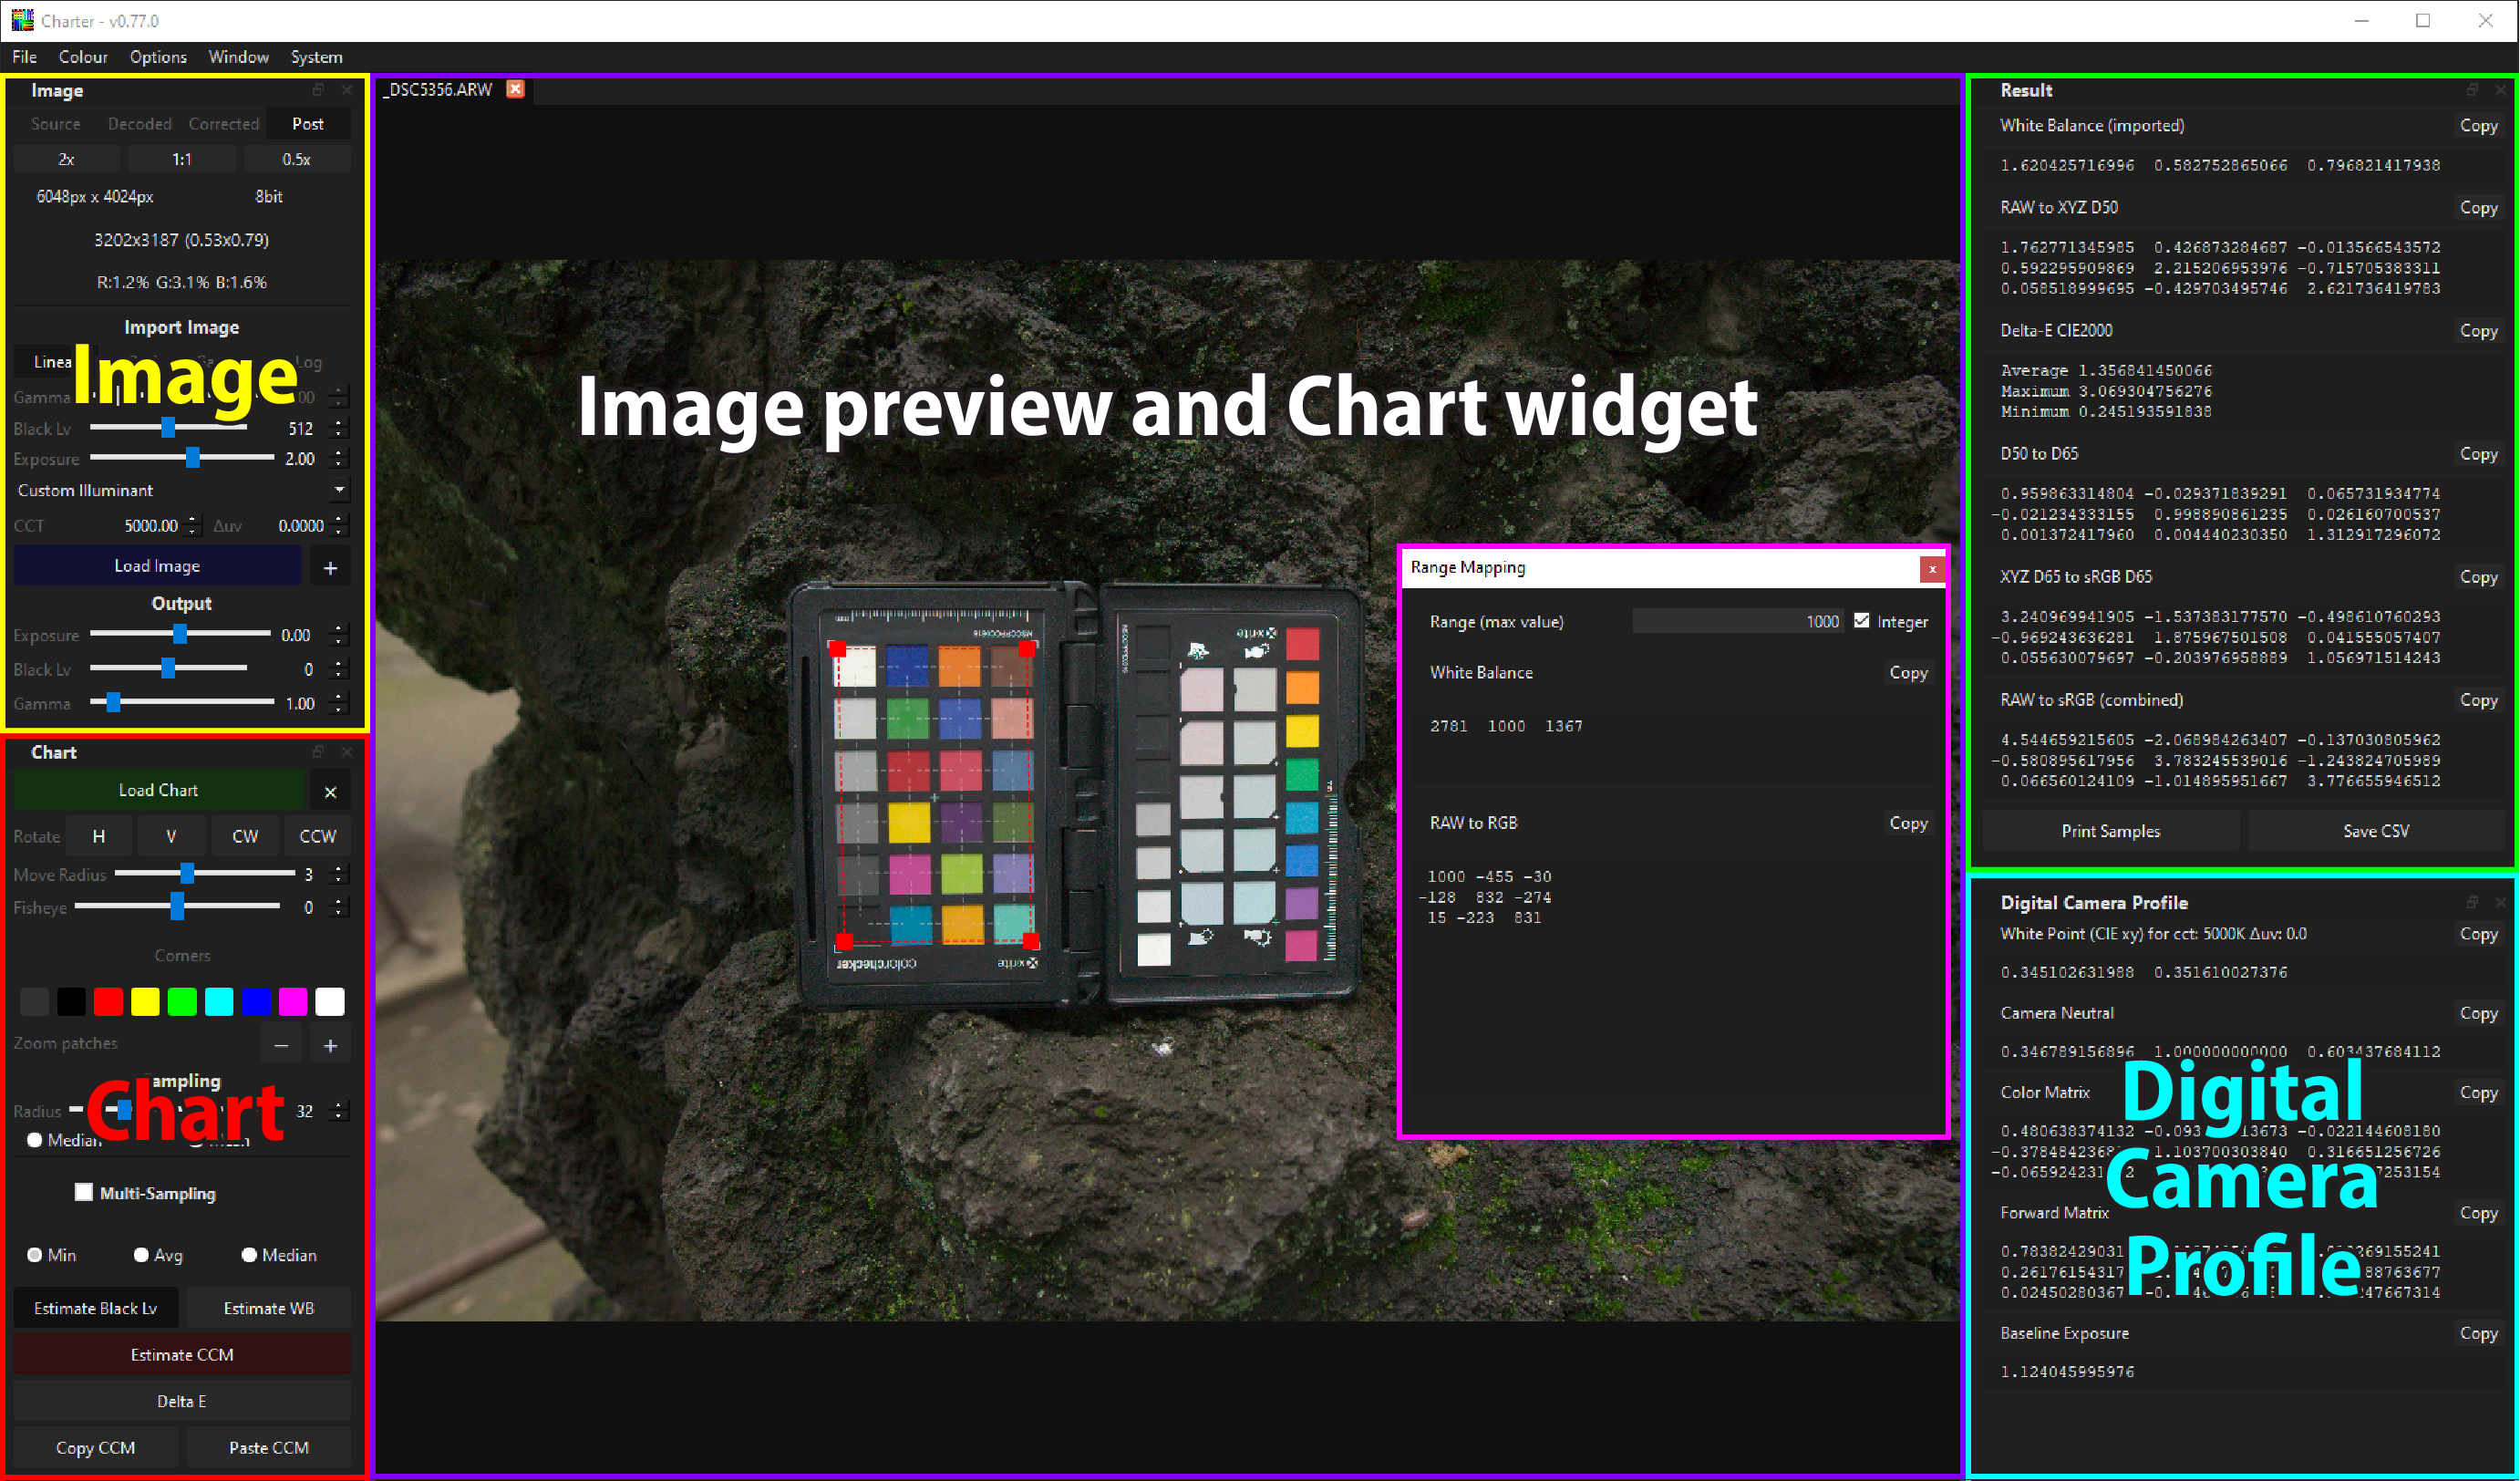
Charter GUI main window has five areas:
- Main Image preview and Chart widget.
- Image control docked window
- *Chart control docked window
- Results control docked window
- Digital Camera Profile docked window
- Range mapping control docked windows (hidden by default)
Main Image preview and Chart widget
The Main area is to work with images and color charts using chart widgets. When the image is loaded, it is possible to view:
- Raw/Source image - rendered on-screen without sRGB gamma.
- Decoded image - rendered as decoded linear values without sRGB gamma.
- Corrected image - rendered as a corrected image with sRGB gamma applied.
- Post-processed image - rendered as a corrected image with post-processing (exposure, gamma, black level subtraction) and sRGB gamma applied.
Image control
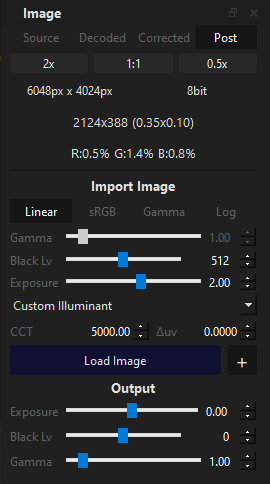
Image import, preview, and post-process control window.
Source / Decoded / Corrected / Post
Buttons to switch between Source (linear), Decoded (linear), Corrected (sRGB gamma), and Post-processed (sRGB gamma) image layers. Using Export Image will export the selected layer.
2x / 1:1 / 0.5x
Buttons to zoom in, fit, and zoom out images in the main window.
Source Image information
Show the information of a loaded image:
- image resolution
- bit depth
- absolute and normalized coordinates under the cursor
- RGB (averaged) value under cursor. (sampling radius control in Chart Control Window)
Import image settings
Linear / sRGB / Gamma / Log
The most important control for importing images. All color computation must happen with decoded values in linear gamma. It is highly recommended that images be prepared in linear encoding. Otherwise, the calculated white balance and color correction matrix will not provide good precision, and the Delta-E error will be higher. In a lousy case, results will completely ruin the source image.
If you must work with sRGB gamma-encoded images, use sRGB mode. If the source image uses generic gamma, please use Gamma and set used gamma. For Log gamma encoded images, use Log and change the menu to the desired log-gamma (at this moment, only tested are S-Log, S-Log2, S-Log3, S-Log3.Cine).
Import Gamma / Exposure / Black Lv
Import image decoding control in order to apply to a raw image value.
-
Gamma - Decoding gamma control. If importing image have used gamma 1.8 switch import settings to Gamma and change Gamma value to 1.8
pow(Source_Value, gamma)(forward gamma) -
Black Lv - Subtracting a black level from a linear image. In the case of sRGB, Gamma or Log input is subtracted after decoding. Black level values are easier to use in a sensor bit depth. For example, for 12-bit sensors that can be around 10-20, for 14-bit sensors 1024-2048, etc.
Decoded_Value - black_lv -
Exposure - apply exposure compensation (shift) to source values. For example, when working with MV camera images, and the sensor has 12 bit DAC, captured raw image can have values in the range 0-4095. These values are stored in 16 bit, and to work with such data, the raw range must be scaled to map the raw range to 0% - 100% of a 16bit. For that, you need to use 4-bit shift or +4EV Exposure in the Charter app. Working with DSLR or mirrorless RAW data (not the camera raw) that can have 14-bit, you need to use 2-bit shift or +2EV Exposure.
Decoded_Value * pow(2, exposure)
Illuminant
Settings is used in Digital Camera Profile (DCP) calculation. Custom Illuminant if selected available those options:
- CCT - Correlated Color Temperature
- Δuv - Delta uv
Standard Illuminants - drop-down list of standard illuminants. If selected, the CCT and Δuv options are disabled.
Load Image
Standard Open File dialogue to open any supported OpenImageIO file formats. If this is a grayscale image, Charter will automatically try to demosaic this image, and the result will be loaded as RGB.
Add New Tab [+]
Add New Tab. After adding a New Tab, you can load another image to work with.
Output image settings (post-process)
- Exposure - exposure compensation for corrected image. If there is no correction yet, post-process settings are applied to source values.
- Black Lv - Black level subtraction
-
Gamma - Gamma correction (backward gamma). The control is similar to image editing gamma correction control.
pow(Value, 1/gamma)
Chart Control
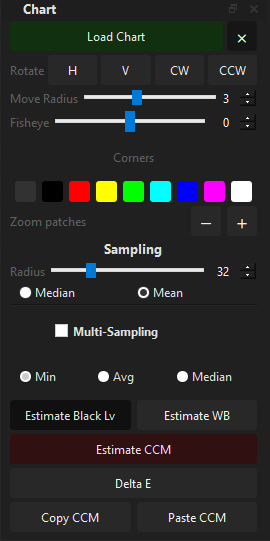
Load Chart
Run standard Open File dialogue and try to load the color chart from the CGATK color chart file format. Inside the Charter app folder, you can find the CGATK subfolder with two color charts with official measurements in LAB.
WARNING!! At this moment, only LAB or XYZ under D50 white measurements are supported. Spectral measurement support will be added soon (and faster if there is a demand for that).
[x]
Reset the color chart coordinates to the initial state.
Rotate H / V / CW / CCW
Rotate or flip the loaded color chart.
- H/V Flip Vertical/Horizontally
- CW/CCW - Clockwise and Control clockwise.
Moving Radius
Elastic dragging control. Set to half of the longest color chart side by default. Allow dragging of the group of color swatches of the color chart widget. It can be helpful to fine-tune chart widget swatches position in case of nonlinear deformation of the chart on the captured image.
Fisheye
Theoretically, it should allow pre-distort color chart swatches using a lens distortion model. WARNING!! At this moment, this is a test implementation, and using this slider will reset all individual swatches to global perspective transformations
Corners
Allow adjust corner swatches colors. From Default RED to Transparent and other colors.
Zoom Patches
Allow for making chart widget swatches smaller or bigger. At this moment, the size of the color chart widget swatches is unrelated to the Sampling radius.
Sampling control
Radius
Control the sampling radius (square window size) that will be used to sample values from the image.
Median / Mean
Averaging algo:
- Median - BoxBlur at sampling window size + Median in half size
- Mean - BoxBlur at sampling window size
Multi-Sampling
Enable multi-sampling mode when more than one tab has images and charts. If all tabs use exactly the same color chart, the average sampled values are calculated using the Multi-sampling mode.
If any of the charts are different from another, all values are combined into a single Mega-chart.
Those sampled values, such as a Single Chart, Multi-sampled Chart, or Mega-Chart, are used in WB and CCM calculation in the next steps.
WARNING!! Mega-Chart mode is not well tested.
Min / Avg / Median
Multi-sampling averaging modes:
- Min - choose the darkest value from the same color swatch from multiple charts. It is best to use when capturing made-under-light spots.
- Avg - average values of the same swatch from multiple charts
- Median - choose the median value of the same swatch from multiple charts
Estimate Black Level
Estimate the black level of the source image. The black level is subtracted from the source image. Often used in RAW processing workflows. Did not estimated on Estimate CCM step. (16-bit integer)
Estimate WB
Estimate the white balance. First, it tries to find all achromatic color swatches in color chart reference values. After that, try to find per-channel scales to minimize the difference between the corrected sampled colors and the ideal achromatic color. If successful, the preview will be changed by applying an estimated white balance to a decoded image. Optional step. Also estimated on Estimate CCM step.
Estimate CCM
Estimate Color Correction Matrix (CCM) RAW Color RGB to XYZ D50. Estimate a CCM by minimization of Delta-E 2000 error between corrected color values and referenced values. If successful, the preview will be updated with a color-corrected (wb + ccm) image. If no WB was estimated, first, will be estimated WB and then CCM.
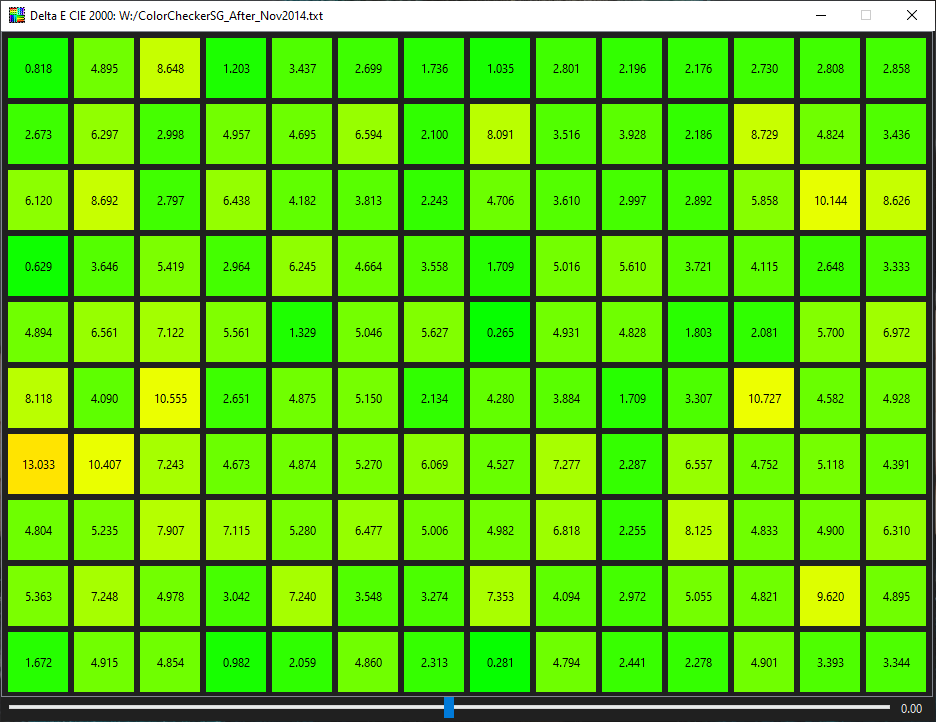
Delta-E
It should show a window with a per-swatch Delta-E 2000 “heat map.”
Copy CCM / Paste CCM
A test feature that can copy WB and CCM from one tab to another and apply them to the image.
WARNING!! Not well tested.